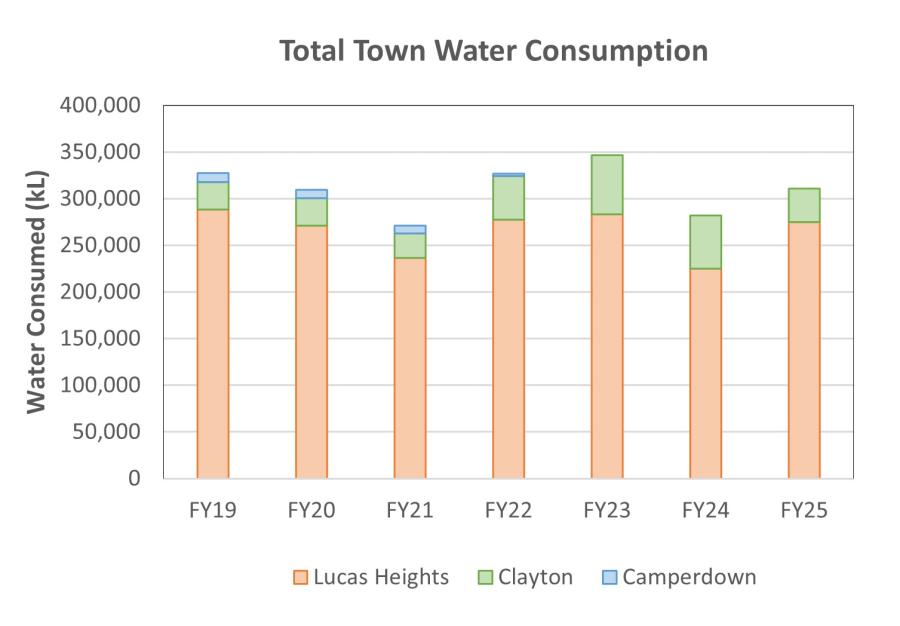

Water Usage
The primary use of water at ANSTO is the OPAL cooling water circuit, which typically accounts for ~70-80% of town water consumption. This water needs to be of a sufficiently high quality to prevent corrosion and scaling of the secondary cooling system, necessitating the use of town water. During the OPAL long shutdown period, town water to supply the cooling system is significantly reduced. This is strongly reflected in the ~10% reduction of town water consumption for this reporting period compared to FY23. The OPAL long shutdown occurred in several months of both the FY24 and FY25 reporting periods.
Town water is also essential for other purposes across the campuses including use in chiller and air conditioning units, laboratories and general staff consumption.
ANSTO has installed rainwater tanks with a capacity of about 275,000 L. These are primarily used to irrigate gardens, the sports field and for some areas that use rainwater for operational activities.
ANSTO continues to investigate options to capture and better utilise rainwater through future developments at its campuses.
Water Usage and Discharge table (FY2024 vs FY2025)
| Water usage | Units | FY2024 | FY2025 | Change on previous year (%) |
|---|---|---|---|---|
| Town water consumption | m3 | 281,782 | 310,735 | 10 |
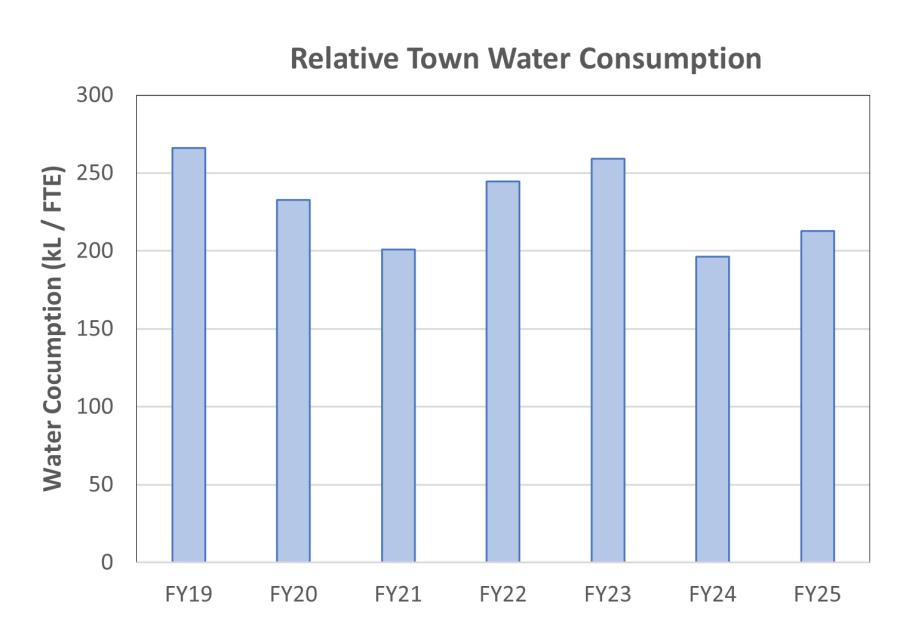
| m3/FTE | 196 | 213 | 9 | |
| Wastewater Discharged to Sewer | m3 | 38,072 | 49,899 | 31 |
| Wastewater Discharged to Trade Waste | m3 | 49,252 | 48,018 | -2.5 |
| Total Wastewater Discharged | m3 | 87,324 | 97,917 | 12 |
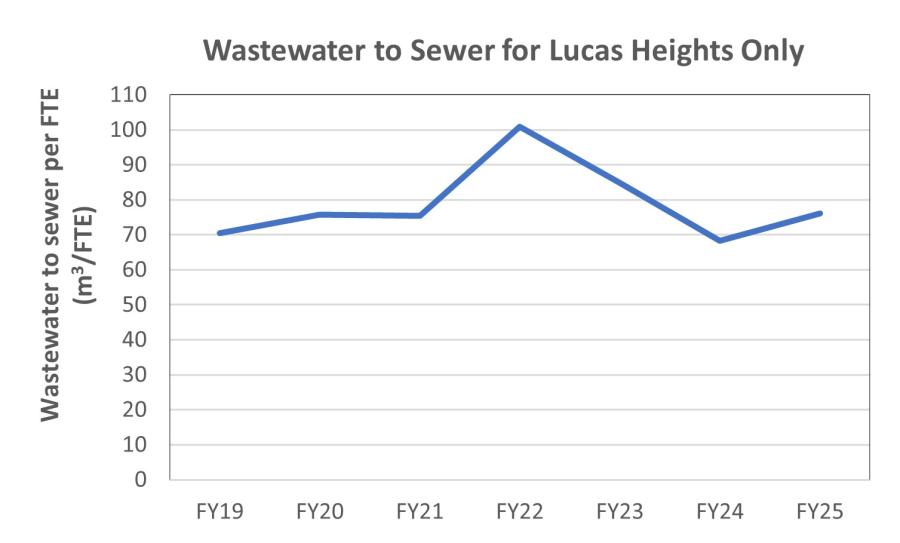
| m3/FTE | 68.3 | 76.1 | 11 |
Wastewater
- The volume of wastewater discharged to trade waste in FY2025 was similar to FY2024. The major contributor to trade wastewater is the OPAL reactor for secondary cooling purposes. The OPAL long shutdown period extended from April to September 2024, meaning there was roughly similar time periods of long shutdown in FY2023 and FY2024.
- The volume of wastewater discharged to sewer in FY2025 was 31% higher than in FY2024 The cause for this increase is not fully understood.
Legend
| kL | kilolitre (1,000 litres) |
|---|---|
| FTE | Full-time staff equivalent attendance |
| m3 | cubic metres |