
Waste Production
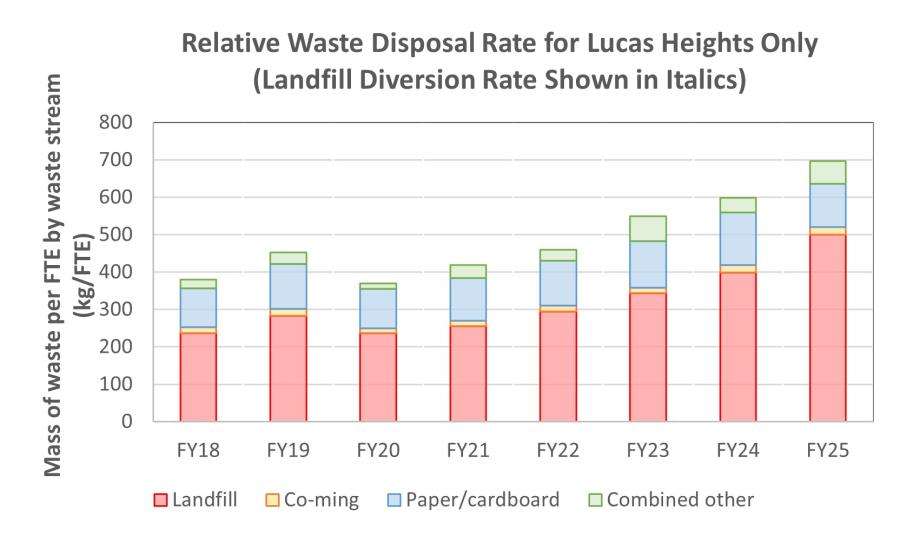
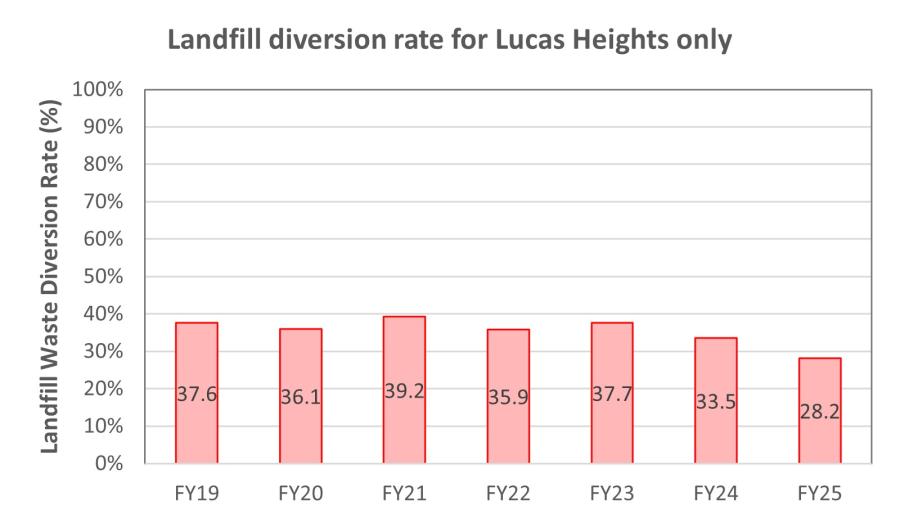
- There has been an overall increase in the amount of waste being generated and the landfill diversion rate has decreased. This may be due in part to an increase in construction activities.
The general and recyclable waste management contract was recently renewed with the objective to substantially improve the landfill diversion rate by opening more opportunities for staff to reuse and recycle, increase staff awareness and training, and reporting capacity. ANSTO is working with the waste contractor to develop strategies which will increase our landfill diversion rate and overall waste reduction outcomes. These strategies will also inform further strategies to extend up through the supply chain with the aim to increase reuse/recycling outcomes and reduce packaging wastes.
ANSTO actively works with its suppliers to reduce the amount of product packaging waste and to enable end-of-life repurposing, reuse or recycling outcomes.
Where practicably safe to do so, ANSTO supplies its commercial health products to customers using reusable or recyclable packages and containers.
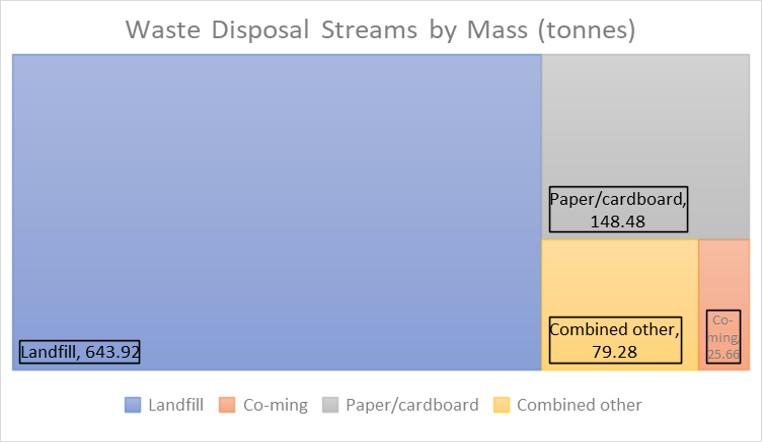
Waste production table (FY2024 vs FY2025)
| Landfill and Recycled Waste | Units | FY2024 | FY2025 | Change on previous year (%) |
|---|---|---|---|---|
| Waste sent to landfill | t | 510 | 644 | 26 |
| t/FTE | 0.398 | 0.45 | 13 | |
| Recycled cardboard + paper | t | 180 | 148 | -18 |
| t/FTE | 0.140 | 0.10 | -26 | |
| Recycled co-mingled containers | t | 25.9 | 25.7 | -0.8 |
| t/FTE | 0.020 | 0.02 | -11 | |
| Other reuse/recycled streams | t | 51.6 | 72.9 | 41 |
| t/FTE | 0.040 | 0.05 | 27 | |
| Landfill diversion rate | % | 33.5 | 28.2 | -5.3 |
Consumables
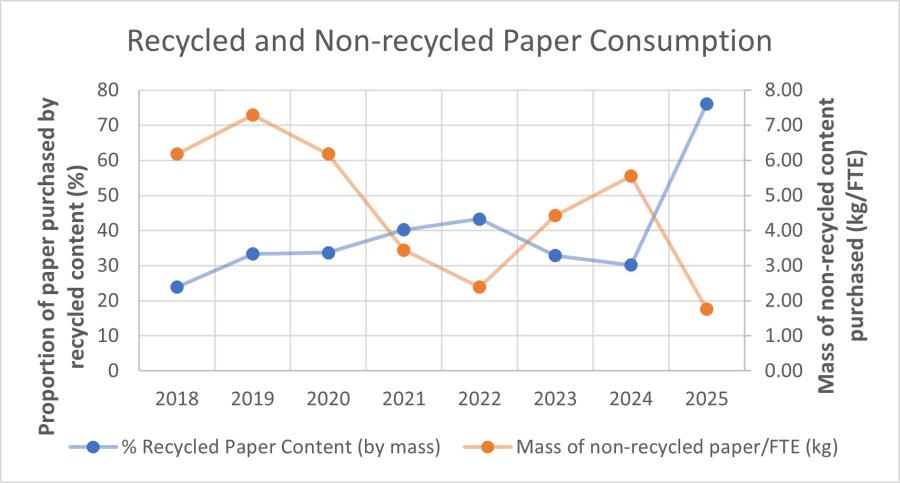
- ANSTO continues to reduce the overall paper consumed and to increase the proportion of that paper which is sourced from recycled paper. This year has seen a step change and a 152% increase in recycled paper use after working with the Whole-of-Australian-Government (WoAG) supplier. This has been achieved through several digitisation delivery projects, the introduction of PaperCutTM to track where and how much paper ANSTO staff are printing and driving initiatives throughout the business to procure paper with minimum recycled content rates.
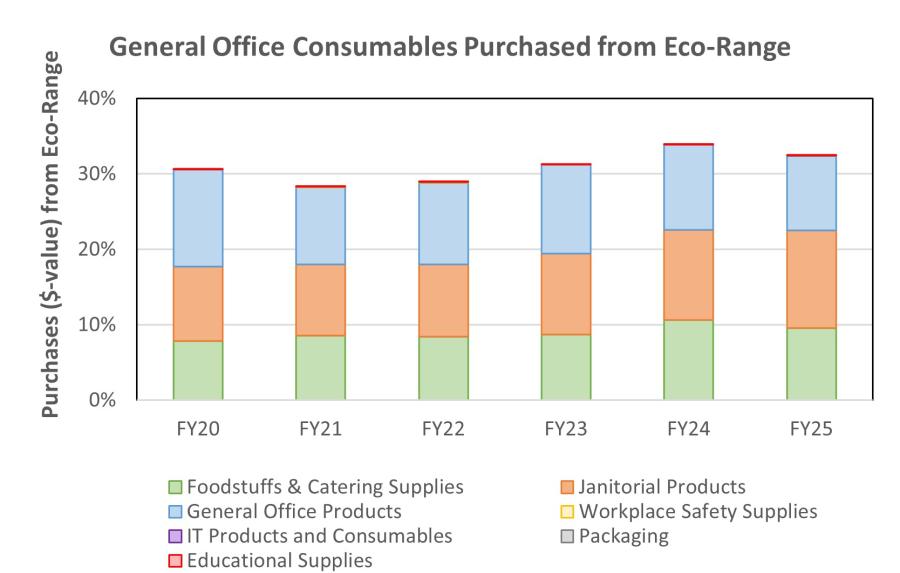
- Through ANSTO’s Whole-of-Australian-Government general office consumables provider, ANSTO encourages staff to purchase items from the available eco-range. This includes a priority on indigenous suppliers.
- In FY25 ANSTO has changed its toilet paper supply from a virgin paper supply to a 100% recycled product from an indigenous supplier that gives back 50% of profits to indigenous education. This change had the climate change impact of taking approximately 2 passenger cars off the road.
Consumables tables (FY2024 vs FY2025)
| Consumables | Units | FY2024 | FY2025 | Change on previous year (%) |
|---|---|---|---|---|
| Recycled paper use | Average %recycled paper consumed | 30.2 | 76.0 | 152 |
| kg non-recycled paper consumed/FTE | 5.55 | 1.76 | -68 | |
| General Office Consumables Purchased from Eco-range | % | 34.1 | 32.5 | -1.6 |
Legend
| kg | kilogram |
|---|---|
| FTE | Full-time equivalent staff attendance |
| t | tonne |
| t/FTE | tonnes per full-time staff equivalent attendance |